The performance of radio frequency identification tags matters a lot. Whether you’re trying to meet the tagging requirement imposed by a retail customer or considering RFID for improving your internal operations, the ability to read tags consistently is the foundation of any RFID-enabled system. You also want predictable tag performance. Otherwise, you might have to boost the power output of the interrogator to read poorly performing tags, which means you could wind up reading a better-performing tag on the neighboring conveyor.
For our second report, “UHF EPC Tag Performance Evaluation,” we examined a number of aspects of tag performance, including yield (what fraction of tags that you buy will actually work) and variance (the difference in the performance among tags of the same model). We measured how quickly tags could be read, both in isolation and when other tags were present, and extensively recounted the results. These tests were thorough, scientific and repeatable. They should take much of the hype out of advertisements, and give end users sound information on which to base tag purchase decisions.

We tested nine commercially available RFID tags based on EPCglobal‘s Class 0, 0+ and Class 1 specifications: Alien Squiggle, I2, and M; Avery Dennison DS1 and Triflex; Symbol I2010, X2040, and I1030; and Rafsec 457.
Most of these models were the same ones we tested for our first report. But due to interest in RFID for pharmaceutical applications, we replaced the Rafsec 458 and Avery Strip, which were discontinued, with the Symbol I1030, which is small enough to fit on a pharmaceutical bottle. Alien, Avery Dennison and Rafsec have similar item-level or pharmaceutical tags, but they were either not released or not available in sufficient quantities to be included in this report.
For our first report, we used scientific, repeatable tests to measure the differences in performance among tags from different manufacturers. For the second report, we set out to quantify the variations in performance among tags of the same manufacturer and model. Understanding the variations in performance is critical because companies must design their RFID systems to read the worst-performing tags, not the best. Otherwise they will achieve very low read rates, which will make it difficult, if not impossible, to get much business value from their RFID systems.
The RFID Alliance Lab performed nearly 1 million read attempts on more than 1,000 tags of the nine different models. We tracked how many tags were dead (unreadable) and how many were quiet (readable but only at very short distances). The results of these tests are explained in this article. The full report, which is available for purchase on the RFID Journal Web site, details the performance of a typical tag for each model and provides the percentage of tags read at various distances.
The full report also examines the read rates of tags when they are alone in the read field and when there are other tags in the read field (the results expose some of the hype from tag vendors regarding read rates). And it explains how the “forward channel” and “reverse channel” impact performance (these terms are defined in the report) and provides the results of some preliminary tests on the write performance of different tags.
How We Tested
Six sigma quality is a term used to describe quality where there are roughly two defects or errors per billion items produced. RFID tags are not close to six sigma quality. In fact, they are closer to two sigma. The RFID Alliance Lab tested at least 100 tags of each of the nine tag models and found a considerable number of dead and quiet tags. We also found considerable variation in tag performance among the tags that did work. Our results show that some of the higher-quality RFID tag models may be nearer to two sigma, or about two defects per 100.
The tests were done in free air, meaning the tag was not attached to an object, but instead suspended in air, free from interference. Tag performance in free air probably won’t reflect your operating environment. But tags of the same model should behave similarly, regardless of operating environments, because that enables engineers to design systems that are consistent and have few defects.
We began by sampling at least 100 tags of each tag model. We placed each tag (except the Symbol I1030) on an extruded polystyrene foam (Styrofoam) board 31.5 inches (80 cm) from the antenna of the reader, or interrogator, centered above the transmit side of the interrogator’s antenna. (Foam is nearly invisible to UHF, so this is essentially identical to testing in free air.) Because the I1030 tag is much smaller than the other models (it’s designed to fit on a pharmaceutical bottle) and therefore has a much reduced read range, we placed that tag at a height of 19.5 inches (49.5 cm) from the reader antenna.
We adjusted the power level of the interrogator by using the interrogator’s software controls to simulate a change in distance. Although reducing power levels only attenuates the transmit channel and not the receive channel, we believe that, based on experimental observation, this still yields accurate and comparable results. More importantly, it allowed us to perform hundreds of times more measurements than would be possible using hardware attenuators.
For each tag, we selected a range of power levels that we thought was the most “interesting”—that is, a range in which the majority of tags would be read at nearly 100 percent and at nearly 0 percent. Within the chosen range, we took measurements with 1/2 dB increments. Then, at each power level, we attempted 50 to 100 reads (more reads were performed on the faster tags), and recorded the number of successful reads to determine the read rate percentage. The data represented in this section comes from testing 1,074 tags and performing 927,150 read attempts resulting in 14,427 data points. Each tag was tested with a minimum of 600 read attempts.
Variations
At each power level for each tag model, we sorted the tags from worst to best. The median tag is the tag in the middle of the sorted list. The black line in the charts on pages 38, 41 and 42 shows the median tag performance for each model. Next, we calculated various ranges in tag performance. Since the number of tags tested for each model varies, we gave each tag a percentile rank, where 0 percentile is the worst-performing tag and 100 percentile is the best-performing tag. The middle 40 percent of tags is shown in the darkest blue color. The middle 70 percent of tags are shown in the next darkest color, and so on. The breakdowns for each of the ranges are shown in the table below.
End users should look for two qualities in tag models. First, well-performing models will have high read rates at high attenuation levels. This represents models for which the majority of tags yields 100 percent read rates at high attenuation levels (remains at 100 percent far to the right on the chart’s attenuation and distance scales).
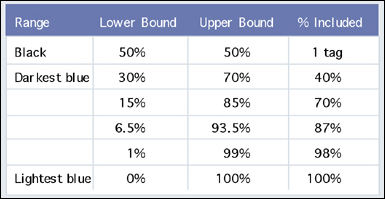
Second, good (low) variation in performance will show up as narrow bands. That is, the difference between the best and worst tags will be very small. Wide bands, especially for the middle 40 percent and 70 percent of tags, are indicative of relatively poor quality assurance and high variance. In real-world situations, it’s often the performance of the worst tag that will determine the limitations of a process. For indications of that, look at how far to the left the 87, 98 and 100 percent bands extend on the chart’s attenuation and distance scales.
All of the tag models have considerable variation in performance, especially with the worst performers. The model with the smallest variation is the Alien Squiggle, but the Squiggle tags still showed about a 3.5 dB difference in performance between the worst and best tags within the 98 percent band. The Symbol I2010 and X2040 have relatively poor (high) variation. Companies looking to purchase tags need to take into consideration both best performance and the amount of variation, since their RFID system has to read all the tags, not just the best-performing ones.
We observed very low variance in performance for the I1030, and none of the tags we tested were dead or quiet, indicating that the I1030 is a high-quality tag. But the read distance was much shorter than any of the other tags we tested because of the smaller antenna.
The measurements from all the models we tested were taken with the same interrogator and, except the Symbol I1030, with each tag placed in the same position and the results plotted on the same scale (the I1030 tag was tested much closer to the interrogator antenna). That means that all the results (except for the I1030) can be directly compared. The bottom scale of each graph indicates the dB of attenuation; the top scale shows the approximate translation in read distance.
To provide an additional measure of the relative performance of the tags, we attenuated the interrogator output by 9 to 17 dB. We ranked the tags based on how many could be read at least 70 percent of the time at each attenuation setting. (Seventy percent was chosen somewhat arbitrarily, but the rankings were similar when we used other read percentages.) A larger number for larger attenuation settings indicates better free-air performance. But differences of a few percent should not be considered statistically significant.
Dead and Quiet Tags
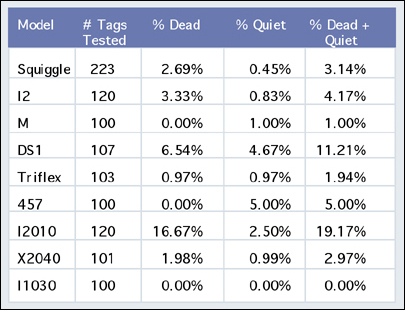
We kept track of the number of dead tags and the number of quiet tags. A dead tag is one that could not be read from a distance of 31.5 inches (80 cm) with the interrogator at full power after attempting at least 100 reads (some tags were marked by the manufacturer to indicate they were nonfunctional, and we discarded those tags). A quiet tag could not be read at any of the lower power settings that we tested for the tag, but was readable at least once with the interrogator at full power.
The performance of a quiet tag is so degraded compared with the norm for that model tag that, for many applications, a quiet tag might as well be considered dead. Quiet tags may actually be more difficult to work with than dead ones, because a label printer or applicator, which reads tags at very close range, might not detect them. The table on the opposite page shows the percent of dead and quiet tags that we observed.
Keep in mind that we tested only a small sample of each tag. Also, it’s likely that all our tags came from the same batch, and there may be variations between batches, so our observations might be conservative.
Companies should consider investing in ways to screen out dead and quiet tags. Even if a tag isn’t quiet, it may not be up to your performance standards. When figuring costs, consider how many tags you’ll need to discard because they don’t meet your minimum performance requirements. Even if tag producers will reimburse you for bad tags, you still need to do the screening yourself.
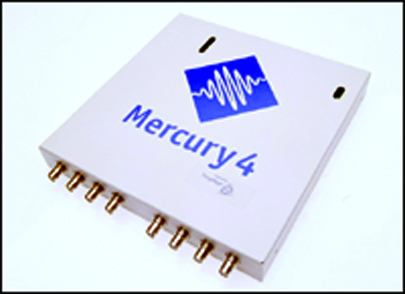
The Interrogator Used for Testing
We used the ThingMagic Mercury4 reader, or interrogator, for our tests because it’s a high-quality, multiprotocol interrogator. ThingMagic makes only interrogators, so there’s less chance that its product is optimized to work well with one brand of tag.
The version of the operating system and firmware are provided in the full report. This information is relevant because differences in software and firmware could yield differences in performance.
The tests were performed using custom software, written by the RFID Alliance Lab, to allow us to control the ThingMagic interrogator to make individual read attempts (since most end users want to ping a tag continually, this is not a feature built into the reader). All tests were performed using the Mercury4’s default configuration, with the supplied cables and antenna. Software provided with the Mercury4 interrogator was used to attenuate the power output.
Conclusions
There are several clear conclusions that can be drawn from this data. First, the Symbol I2010 and X2040 perform significantly better in terms of read distances than the Class 0 and Class 1 tags. Both the I2010 and X2040 tags are Class 0+ tags; the two Avery tags are Class 0 tags and do not perform nearly as well. One likely explanation for this is that the two Symbol tags use 256-bit Class 0+ chips, and the Avery DS1 and Triflex use 64-bit Class 0 chips (although Avery claims that the DS1 and Triflex are 96-bit tags, in our tests, we could read only 64 bits). The Class 0+ tags may require less power to operate than their older Class 0 counterparts, and the Class 0+ tag design uses an external capacitor (two metallic plates separated by an insulator used to store electrical energy). A larger capacitor can hold more energy and potentially boost performance.
While not as robust as the I2010 and X2040, the Rafsec 457 clearly outperforms all other Class 1 tags that we tested. The Rafsec 457 uses a 96-bit Class 1 chip, while all the other Class 1 tags use a 64-bit chip. Again, the chip is the likely explanation for the difference in overall tag performance.
Another difference between the Rafsec 457 and all other Class 1 tags that we tested is that the Rafsec 457 does not use a strap (a strap is one form of what’s known as an interposer). A strap encases the RFID chip and has leads that connect to metal pads. These pads attach to the antenna. The strap may introduce a source of loss in performance, especially in the strap-antenna connection, but we have not verified this.
The results of our lab tests show that none of the RFID tags we tested provide consistently good performance. If you have to meet mandates from customers—or need to read tags 100 percent or nearly 100 percent of the time for a particular business process—focus on the worst-case performance of tags, not average or best-case, because your system will have to be designed to accommodate the worst-performing tags.
The complete report, “UHF EPC Tag Performance Evaluation,” can be purchased online by clicking here.