
Nov 10, 2015No company deploys Internet of Things technology because it just wants to use more sensors. It's the data those sensors capture that matters. Yet, just capturing data is not enough. In order to avoid a business loss—a manufacturing process coming offline, for instance, or a turbine at a power plant failing—sensory data needs to be analyzed in real time, so workers can respond to anomalies that are the harbingers for these types of losses before such losses occur. Simply collecting and storing sensory data, in industrial applications such as these, does not provide any real business value.
"IoT introduces wrinkles [into your operations] because data is arriving at a high rate," explains Steve Ehrlich, senior VP of marketing and product management at Space-Time Insight, a data-analytics service provider. "And it's not just coming in fast, but also very often it's dirty, and most companies are not necessarily geared toward dealing with that. So analytics are often required to clean the data before you even decide what to do with it."
Since before the current proliferation of low-cost, networked sensors, companies in the industrial sector have collected and stored time-based data relating to machines or processes in what are termed operational historian databases. Applications would then analyze this stored data to generate metrics.
"A decade ago, customers with big data would use a data-warehousing approach and look to get reuse from dense stores of data—looking at customer transaction data, for example," says Chad Meley, VP for unified data architecture product and services marketing at Teradata, a provider of data-analytics services.
Over time, those applications evolved into what are known as complex event-processing platforms. Then, as the volume of data grew, the enterprises realized they wanted to analyze it as they were collecting it, resulting in the emergence of tools for advanced streaming-data analytics. This type of software performs three important functions: analyzing a wide variety of event- and time-based data types (a system could consume data from a wide range of sensors, detecting anything from temperature to vibration to light), analyzing it as soon after collection as possible, and comparing the data with models that convey what it should be showing in order to then detect anomalies.
"Typically, the events, such as sensor readings, are ganged together and aggregated in a window based on time or on the number of events," explains Fern Halper, advanced analytics research director at market research firm TDWI. Filters are used to find only the relevant data from the stream and pull that information into these windows that are only open for a certain amount of time. And as the data is compiled, the software runs calculations. "In complex event processing, you'd do things like take subtotals or averages of data coming through. You might want to track temperature—say, so once every 10 seconds, the software captures a window of temperature data and calculates the average. And then, the next window comes through. And with each window, the software decides if an alarm needs to be sounded, based on temperature thresholds that the user has set."
The total volume of the data is high, and is streaming in at a fast rate, so what the streaming-data analytics software is most valuable for is finding the few but important clues the data holds. "Ninety-nine point something percent of the data will show that the system is working as it should," Meley says, "but every once in a while, we'll see that something is spinning too fast or getting too hot."
Adoption
It is worth noting that these are still early days for advanced streaming-data analytics software. Last month, Gartner reported that investments in software to manage big data (overall, which would include data from IoT systems, as well as other sources) have slowed in the past year, compared with the two years previous. And advanced streaming-data analytics software is just a subset of this class of software. Plus, while the IT professionals Gartner surveyed are still very focused on data analytics, the biggest uptick in investments is in enhanced data-security capabilities.
In a survey it conducted in May 2015, TDWI found that fewer than 20 percent of respondents (a mix of 400 people in a range of industries, the majority of them IT professionals) are currently using IoT data. However, 40 percent said they will begin using IoT in the next three years.

If the many predictions around rocketing growth in the IoT sector during the next five years come true, enterprise users of IoT technology will undoubtedly need to bolster their ability to quickly analyze incoming data from numerous sources and be able to quickly act on that information. Otherwise, those IoT investments will not have the financial returns that end users expect.
The Players
All of the major enterprise software providers offer streaming data-analytics software or services: IBM (IBM Streaming Analytics), SAS (Event Stream Processing), SAP (HANA Smart Data Streaming), Oracle (Stream Explorer), Microsoft (Azure Stream Analytics) and Tibco (StreamBase). These programs are available through various models, in some cases as a managed service, through a software license, or as software-as-a-service or platform-as-a-service, and increasingly these are cloud-based offerings. Google and Amazon Web Services also offer cloud-based streaming data-analytics services (Cloud Data Flow and Kinesis Analytics, respectively).
There are also a number of vendors that specialize in data-analytics software and services. These include not only Space-Time Insight and Teradata, but also Actian, Cloudera, Hortonworks and Infobright, and the marketplace of data-analytics providers is expanding. ParStream is a data-analytics platform developed specifically to manage IoT data. On Oct. 26, networking giant Cisco announced that it is acquiring the company.
All streaming-data analytics rely on two key infrastructure elements: a database to manage the data and an analytics engine. Overwhelmingly, vendors employ open-source software to develop these solutions—specifically, the Apache Software Foundation's Hadoop databases and Spark Streaming programming tools.
Use Cases
The list of potential uses for streaming-data analytics is nearly as long and varied as the list for IoT technology applications.
"Say you're tracking an oil rig," Halper says. "You'll be collecting all kinds of sensor data [from various systems on the rig]." When it comes to responding to oil-rig failures, she adds, timing is vital. With streaming-data analytics, an oil company can create a model, based on historical data showing what types of output the sensors should be generating, per the rig's normal operation. "You take that model and put it into event stream," Halpern explains, and the company will then receive alerts as soon as any of the sensor data exceeds a set parameter.

Space-Time Insight's Ehrlich says the value of streaming-data analytics is not just a big-data story, but a small-data story as well. "When we talk about big data," he notes, "it's interesting because a company in the utility sector might ask: 'I have 10 million smart meters, so I can see them on the screen at once, right?'" But that is not where the analytics services matter. "The question they should be asking is: "Which of these 10 million meters should I care about right now?'"
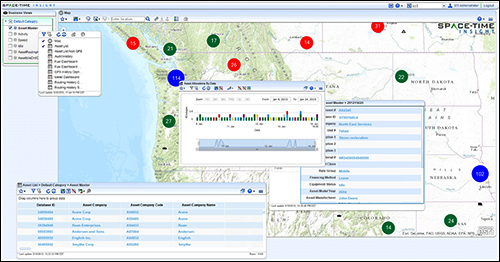
Space-Time Insight conveys results from its streaming-data analytics services through visualizations, so its customers can easily and quickly access the data as it is analyzed. Ehrlich says one of his customers—a Fortune 400 firm in the construction industry—relies on this feature to control costs.
Using Space-Time Insight software, the customer's field staff can access visualizations—based on data pulled through a cloud-connected GIS system and GPS data collected via telemetry systems installed on the equipment—that put context to the equipment's operation.
"This customer managed 15,000 pieces of equipment," Ehrlich says. Space-Time Insight creates maps that show which trucks are speeding, based on local laws, which is used to alert drivers, thereby encouraging safer driving but also reducing the likelihood of a speeding ticket. Through the use of asset tags, the software also helps the company keep tabs on its equipment's locations. Additionally, companies that operate construction and road maintenance vehicles are eligible for state and federal fuel tax credits for non-highway use. Based on the vehicle's real-time location data, he explains, Space-Time Insight can route operators in a manner that maximizes these tax credits. According to Ehrlich, these monitoring and optimization services translate into millions of dollars in annual savings for that customer.
Before the emergence of streaming-data analytics tools, explains Teradata's Meley, businesses used to think their data only had value after it was warehoused and mined for insights over a long period of time. "But with IoT, we see all data has value," he states. "Being able to go in and look at data in raw form [as it is being collected] can really help."